Maybe the following could be worthwhile :
- 3 D scatterplots with 4 different datasets being displayed.
- Displaying 2 logs at the same time so you can make comparisons between them both in linear logs and scatterplots.
feature request
Moderator: LT401Vette
-
LT401Vette
- Super MS/Extra'er
- Posts: 12732
- Joined: Sat Jul 16, 2005 8:07 am
- Location: Moorseville, NC
- Contact:
Re: feature request
You can load 2 logs now for linear view.- Displaying 2 logs at the same time so you can make comparisons between them both in linear logs and scatterplots.
File --> Compare to
But on the scatter plots, what are you picturing?
Perhaps be able to select which data set each scatter plot is based on? That would let you put 2 side by side and set them up the same, but one on each file.
Phil Tobin
EFI Analytics, helping to simplify EFI
Next Generation tuning software.
Supporting all MegaSquirt versions and firmwares.
http://www.TunerStudio.com
http://www.efiAnalytics.com/MegaLogViewer/
Support the firmware running your engine:
http://www.msextra.com/doc/donations.html
EFI Analytics, helping to simplify EFI
Next Generation tuning software.
Supporting all MegaSquirt versions and firmwares.
http://www.TunerStudio.com
http://www.efiAnalytics.com/MegaLogViewer/
Support the firmware running your engine:
http://www.msextra.com/doc/donations.html
Re: feature request
Will try the compare function. Haven't done so far.
As far as the scatterplots is concerned : yes it would be helpfull if you could plot 2 logs in the screen without having to switch from one to the other.
With 3D I mean something like this :
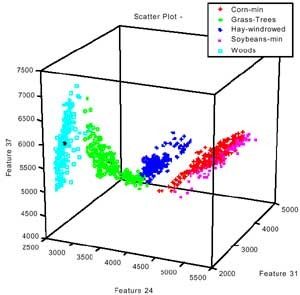
It gives you the opportunity to graph 3 variables at once and see how they interact. Personally I would use it with the more advance type of analysis based on logs.
It could also be useful to make predictive equasions, especially with 3D plots. However this is pretty advanced stuff.
As far as the scatterplots is concerned : yes it would be helpfull if you could plot 2 logs in the screen without having to switch from one to the other.
With 3D I mean something like this :
It gives you the opportunity to graph 3 variables at once and see how they interact. Personally I would use it with the more advance type of analysis based on logs.
It could also be useful to make predictive equasions, especially with 3D plots. However this is pretty advanced stuff.