I have some potentially silly questions for TS3 - any way;
1) The new colourisation of the 2d tables for the line graphs I find rather annoying as I want to see the data pairs as a value pair rather than individual entries as the colours indicate. Is there a setting to have the colourisation no be present or make to lead colour the colour for the data row?
2) When the car is running and I am looking at a 2d data graph or table I would like the value being drawn from that graph or table shown on the graph/window (such in the top left title area or such). Is it already present and I just cannot see it.
Any way, just asking the questions and see if I am right wrong or should change my ways. Thank you.
TS3 - questions
Moderator: LT401Vette
-
kaeman
- Master MS/Extra'er
- Posts: 643
- Joined: Sun Nov 06, 2005 12:31 am
- Location: NORTHERN CALIFORNIA
Re: TS3 - questions
The values are high lighted when you have a 2d table or a graph open and the engine running. I have no idea on the other question of colorization, haven't paid that much attention.
64 el camino, 383 SBC, 11.7 to1 CR, accufab tb/rhs intake, 44lb injectors, trick flow heads, xr292r solid roller cam, belt drive camshaft, dry sump oil system, 2400 stall, turbo 350, spooled 9 inch, strange axles, 3.89 gears, dual wideband, full sequential fuel/cop, MS3x using 1.4.1 code.
Re: TS3 - questions
Thanks for the reply. So more information please - lets look at an example.
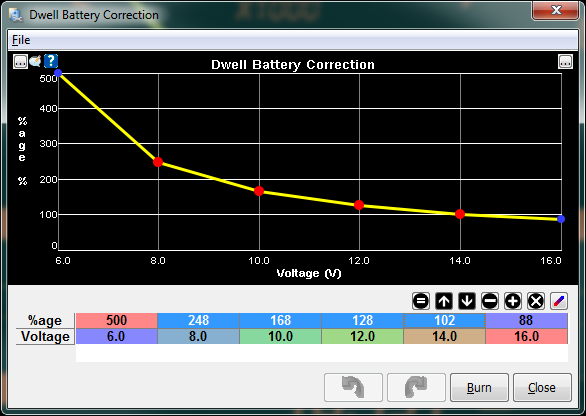
See the lower table that makes up the points in the graph hence each are a related pair.
They have different colours that in this context has no meaning and to me separates the
relationship between the pair. Can the colours be turned off by configuration or one colour
used such as the Y (aka the primary) value colour only for that pair row.
Secondly when the engine is running a vertical line appears and a dot on that intersection
point shown to illustrate the current value point on that graph. Great and it is nice - but
the actual input value and the value define by the graph point does not get shown precisely
meaning you look on the graph and have a guess to what the value may be. I would like to see
the actual value in and out on the graph. You indicated it would be there and I cannot see
where so your guidance would help me.
Thanks.